Innovators Marketplace on Data Jackets
Summary
In order to make a social environment where analysts and decision makers in active businesses and sciences can be provided with data they need, we have been discussing why we should and how we can (re)design an environment called the market of data, where each user or provider of data can externalize and share the value of each dataset (or each part of data) for/by buying/selling/sharing/exchanging data in a reasonable condition, e.g., for a reasonable price or as open source if it may give merits to people in general rather than to a particular segment of users.
As one way to go, reflecting the above discussion, we came to start developing a systematic design of the market of data, that is called Innovators' Marketplace on Data Jackets (IMDJ). In IMDJ, an experimental market of data has been configured by introducing the workshop method called Innovators Marketplace (R) we developed in 2008, Data Jackets (DJ) representing metadata formatted to fit the communication of actors including users, providers, and brokers of data, and information systems to activate the market.
The process of IMDJ: Three simple steps toward data synthesis
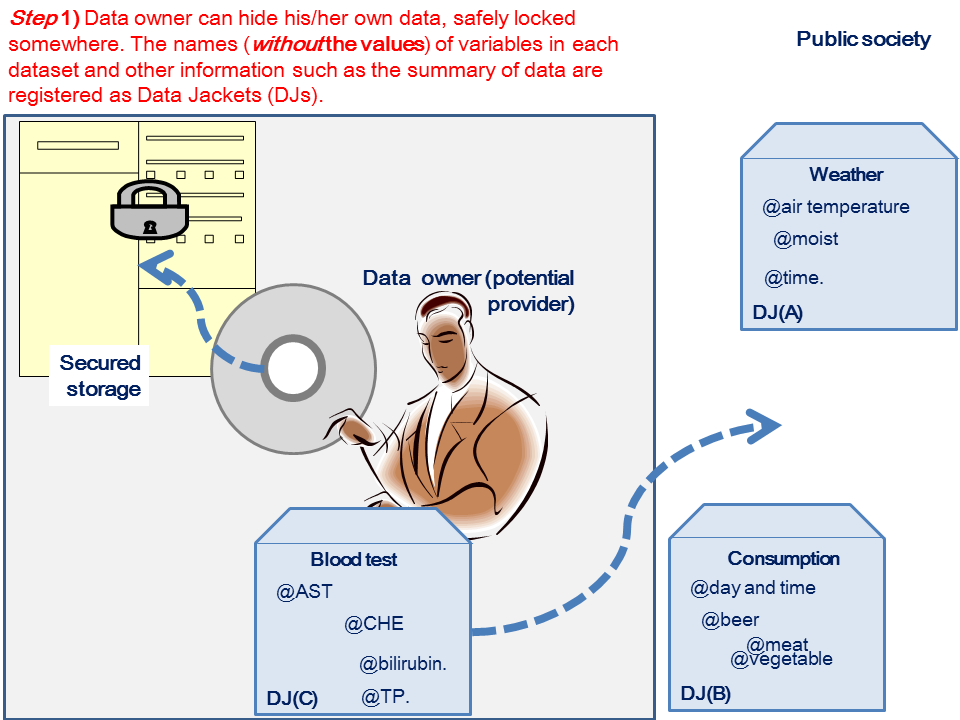
Step one: Entry to the market of data with your own DJ
If interested in being a participant of the market, one may hide one's own - priceless- data or lock it up somewhere. The names ( not the values) of variables in the data and other attributes (including some text summarizing the data) should be subscribed here, as far as one intends to publish those pieces of information on data jackets. The information in each DJ works as advertisement for providing the corresponding data to suitable users in a suitable condition - for a reasonable price or as free, open source, if both the provider and the user of the data like.
(click to enlarge the figure)
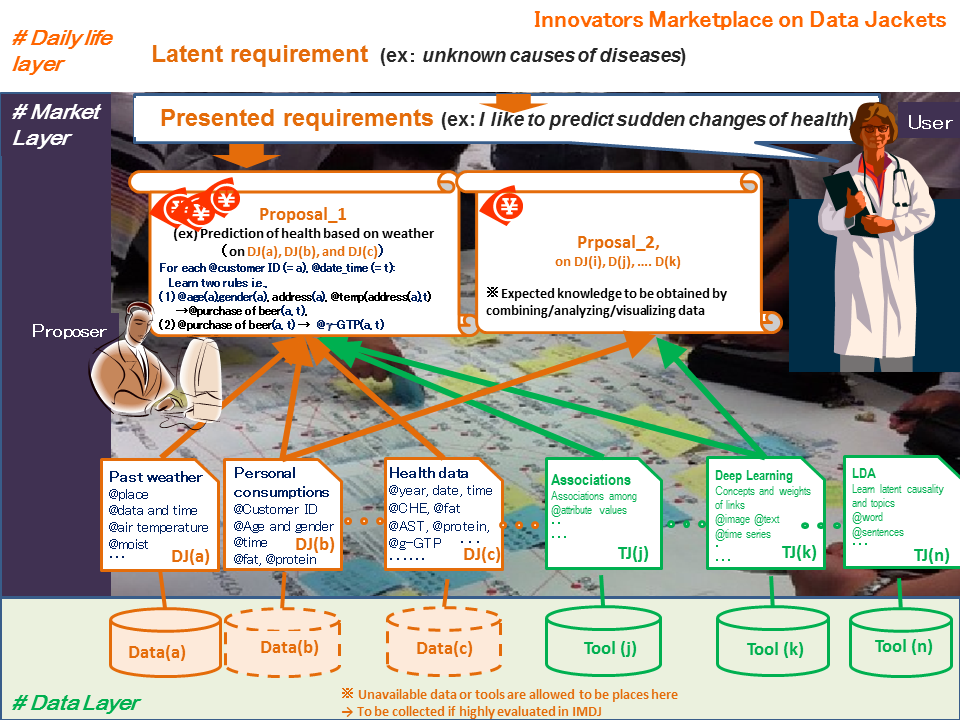
Step two: Visualization of the market of data (optional, but essential)
On sharing DJs with other participants of the market of data, the DJs shall be linked via variables and keywords included in the summary. These links will be visualized as the map of the market. Explicit relations between the variables may be also given by the data provider in such a traditional way as linked open data, in which case those given relationships will be merged with automatically computed links. However, this is not strongly encouraged because the interests of data provider tend to be tacit (hard to externalize).
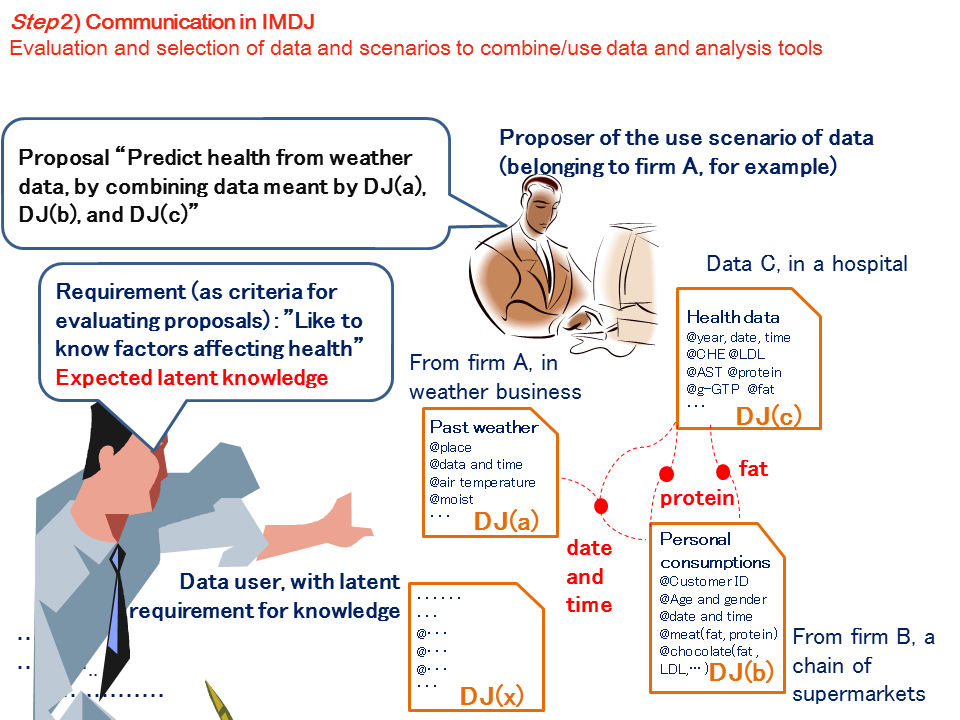
Step three: Communication - discussions about scenarios for using/reusing/exchanging/sharing.... data
On the visualized map above, that can be regarded as the atlas of data market, participants (including providers, users, brokers, etc. of data) of can evaluate the values of data, with considering and discussing the use scenarios of data, i.e., which data are relevant, how to combine the data sets, and other features of each dataset (such as size, granularity, trustworthiness, etc). As a result, selected data may get to be shared free, sold for the agreed price, or exchanged in other conditions.
(click to enlarge the figure)
An example
Just look... You will be motivated to combine datasets for discovering new facts in the new world and for creating new value in the new market.
(click to enlarge the figure)
For your first step - entry Sheets of Your Data Jackets -
Please feel free to enter your DJ by filling the DJ form on the Web.
Or you can fill in and send the Excel version(available also in Japanese) to us anytime. In the latter case, the email destination is info (at:should be replaced with '@') panda.sys.t.u-tokyo.ac.jp.
Just find the exmple as shown in the PPT file to understand what to fill in each blank. Deadline for entries: Not given - you are welcome all time in the future.
Please note we are at an experimental stage as far as you access via this Web page. For further entry, you are advised to join our communcations in the market of data