Yukio Ohsawa (大澤幸生)
Professor, School of Engineering,
The University of Tokyo
(from July 2009)

-
Contributions to sciences and engineering
- Research interests
- Feature concepts for data-federative innovations
-
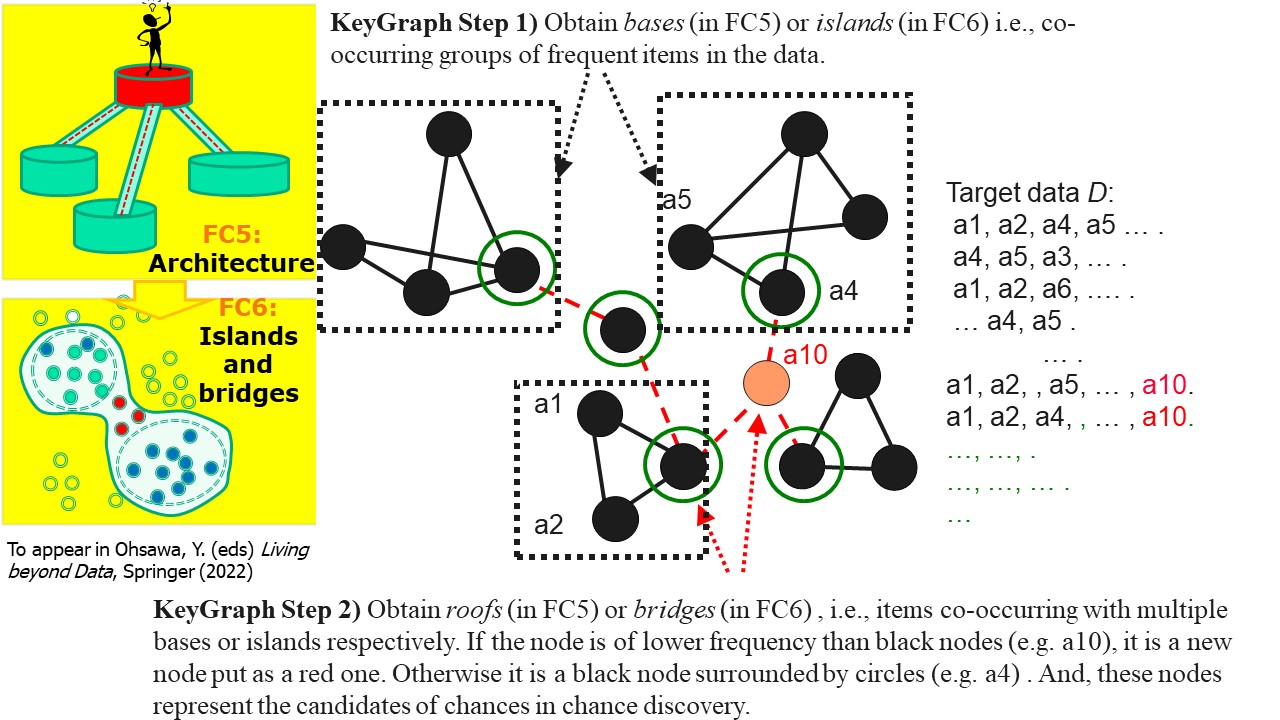
A feature concepts is an abstract of the information or knowledge to be acquired by using data linked to the method, the reason, and the dataset(s) for satisfying a requirement. A FC is represented in various, but can be generally illustrated as images as follows
(Ohsawa et al: [2111.04505] Feature Concepts for Data Federative Innovations (arxiv.org))
-
For example, trees and clusters are the feature concepts respectively for de-cision tree learning and for clustering. Useful feature concepts for satisfying a requirement of users of data have been elicited so far via creative commu-nication among stakeholders in the market of data. The cases of applying FCs include chance discoveries in marketing, designing products, medical treatments, change explanations in markets and precursor explanation in earthquakes.
- The market of data as a place for innovations with data
- Data are created, collected, exchanged, combined, and operated (processed, analyzed, or visualized) on digest information called Data Jackets. Because data jackets (DJ) do not necesarily include the content of data, participants of the market of data are free from the risk to leak privacy and other confidential information, until they find "solutions" that are scenarios about (1) how and from/with whom to design and collect data, (2) how to operate the data to acquire useful information,
(3) how to use the acquired information for actions in businesses.

-
The basis of IMDJ is that the value of anything is defined in the market. In the market of data, providers and analysts (can be called data scientists if you like) of data and/or tools with AI communicate to evaluate the utility and the price of data, with involving users i.e., those who use analysis results. Innovators Marketplace on Data Jackets (IMDJ) is a process including a gaming session involving these stakeholders. Here, analysts create ideas even if data are confidential, by sharing Data Jackets (DJs) showing just the title, the summary, and noteworthy variables in the existing data or data to be collected. If an idea matches a requirement of some participant of the market, the idea and the data represented by the DJs will be priced on negotiation. 1000 DJs have been collected so far by the private and the governmental sections. For example, DJs about weather and another about food consumption have got disclosed, although the data contents should/can not be. As in this figure, the negotiation between a provider, an analyst, and a user reach an agreement to share data, based on an idea created in IMDJ. The idea is here to combine datasets, one about weather, another about liquor consumption, and the other of blood tests owned by the user who is a doctor, to discover knowledge such as “one tends to drink beer and get g-GTP increased if the air temperature is higher by 3 degree than the average of 10 days before”-- may be useful for health care.
- Side products of IMDJ
- Business ideas have been created -- showing safe paths with street lights, presenging the transition of customers states of interests, designing refrigerator with a pocket with function to count the number of beer cans, etc. However, these are not all. The AI technologies created in our lab include Tangled String, Non-confirmity change detector, dynamic deep net, and graph-based entropy. We are stepping to the new generation of AI with integrating these original technologies, to create such as the Network of Demons.
-
Tool as a product of IMDJ: Tangled string (Ohsawa, Y., and Hayashi,T., "Tangled string for sequence visualization as fruit of ideas in innovators marketplace on data jackets", Intelligent Decision Technologies (2016), DOI: 10.3233/IDT-150251, Ohsawa,Y., "Tangled String Diverted for Evaluating Stock Risks - A by Product of Innovators Marketplace on Data Jackets" MoDAT2015 (Workshop on Designing Safe and Secure Life on the Market of Data), in IEEE International Conference on Data Mining, Atlantic City (2015))
-
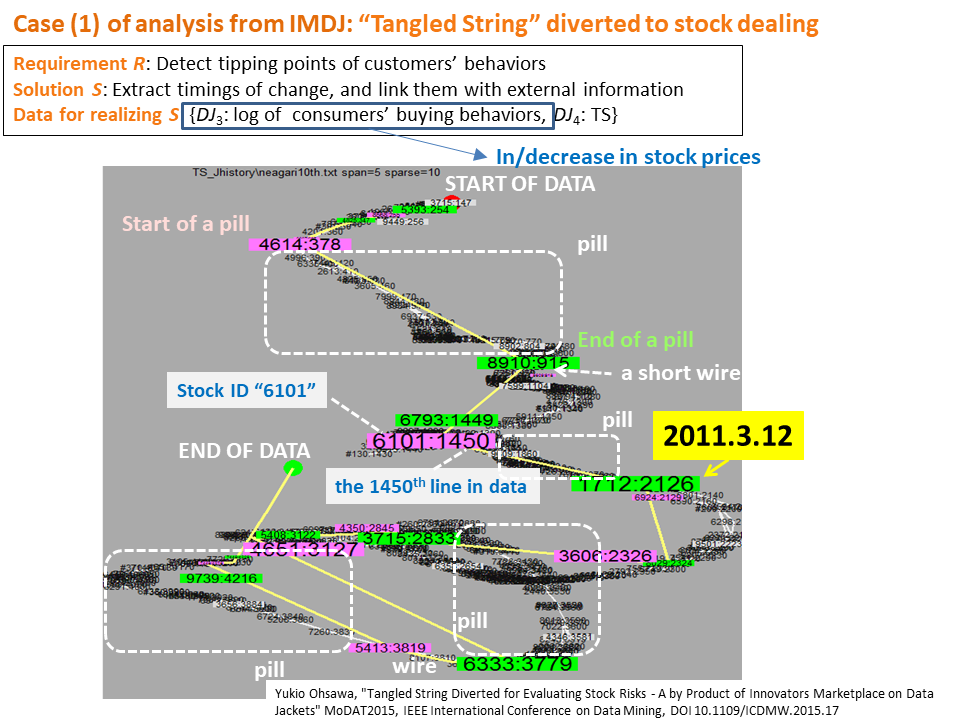
One of the motivations to design Tangled String and divert it to various applications was to detect tipping points of customers’behaviors, a requirement in IMDJ, for which the proposed solution included to visualize and explain the timings of change in sequantial data. Because TS is good at dealing with a sequence, hard to explain on a fixed set of topics, the latent changes in the market could be grasped even where consumers do not share topics of interest. In TS, frequent items in a stagnmation of event-flow (called a pill) are called “key items in a pill”and an item on a path (called a wire) from a pill to the next pill is represented by a large red or green node in the output visualization of TS. A red (green) node represents the start (end) of a pill, can be regarded as the essence of the flow in the sequence, because the contextual flow or the causal structure in the sequence will be broken if any item on the wire is lost. In this TS, for the time series of top 10 stock prices in Japan for 9 years, the stock ID 1712 on the 2126th day which was 12th May 2011 was of a consultation company of environment setting e.g., cleaning the soil from radiation, and the pill before it had some of power generation. Thus we can understand the Fukushima accident affected substantially to the change of stock prices.
-
Tool as a product of IMDJ: Dynamic Deep Learning (Ji, Y., Ohsawa, Y., Memorizing Transactional Databases Compressively in Deep Neural Networks for Efficient Itemset Support Queries, ICONIP2017 Best Paper Finalist)
-
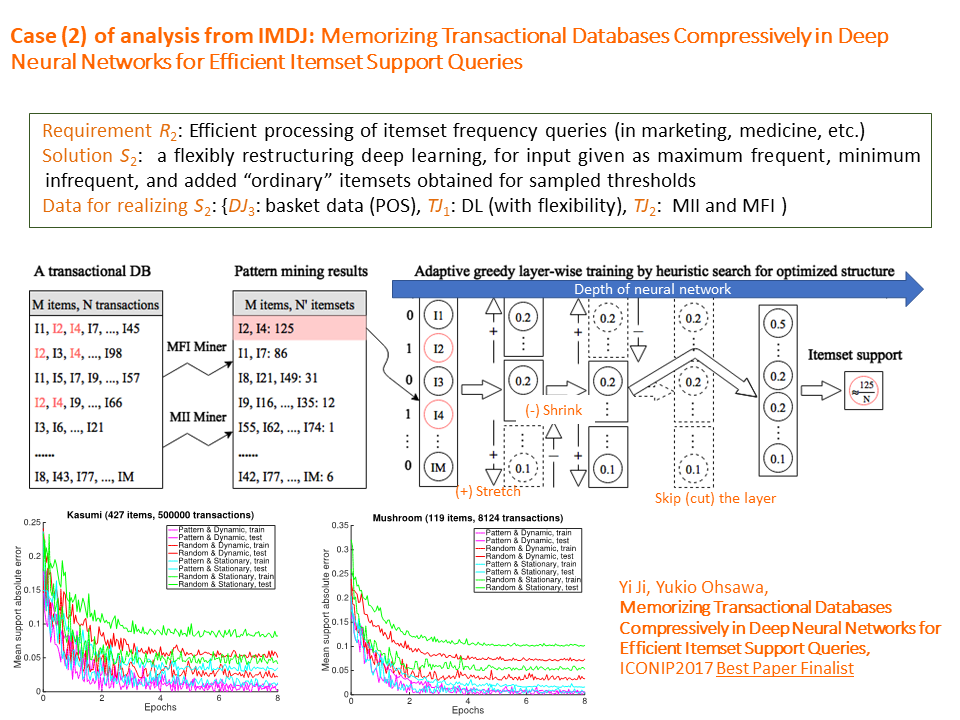
To understand consumers' behavior, an efficient processing of itemset frequency queries is essential. For example, if some customers buy banana and beer at the same time, the marketer should be interested in the reason for this queer behavior. If enough support is found, maybe there is some reason. Here, by selecting maximum frequent, minimum infrequent, and additional "ordinary" item-sets of randomly sampled different supports, and learning the itemset-supports correspondence by use of originally extended deep net, the transactional data is compressively memorized to enable efficient management of itemset support queries. About the figure, the arrows in the direction of X axis: from left to right the depth of the network increases. The arrow means it try to add the next layer. Each vertical bar, i.e., each rectangle including circled digits is a layer, where the circles represent neural units. Dotted rectangles and circles mean the deprecated part of the units (in failed trying to adjust the size of next layer), and the arrow with “+” and “-” mark represents two kinds of adjustment: shrinking and stretching. Solid ones are the sustained parts.
- Also see the interests shared with my laboratory
- Contact
- E-mail: ohsawa -at- sys.t.u-tokyo.ac.jp
- Laboratory
- Chance Discovery and the Market of Data
- Department
- Department of Systems Innovations, School of Engineering (The Univ. of Tokyo)
- E-mail: ohsawa -at- sys.t.u-tokyo.ac.jp